 Vidiyo
Read your analytics
Read views, sessions, watch time, and ad impressions across your account, drill into one channel, check retention, and export the numbers as CSV or JSON.
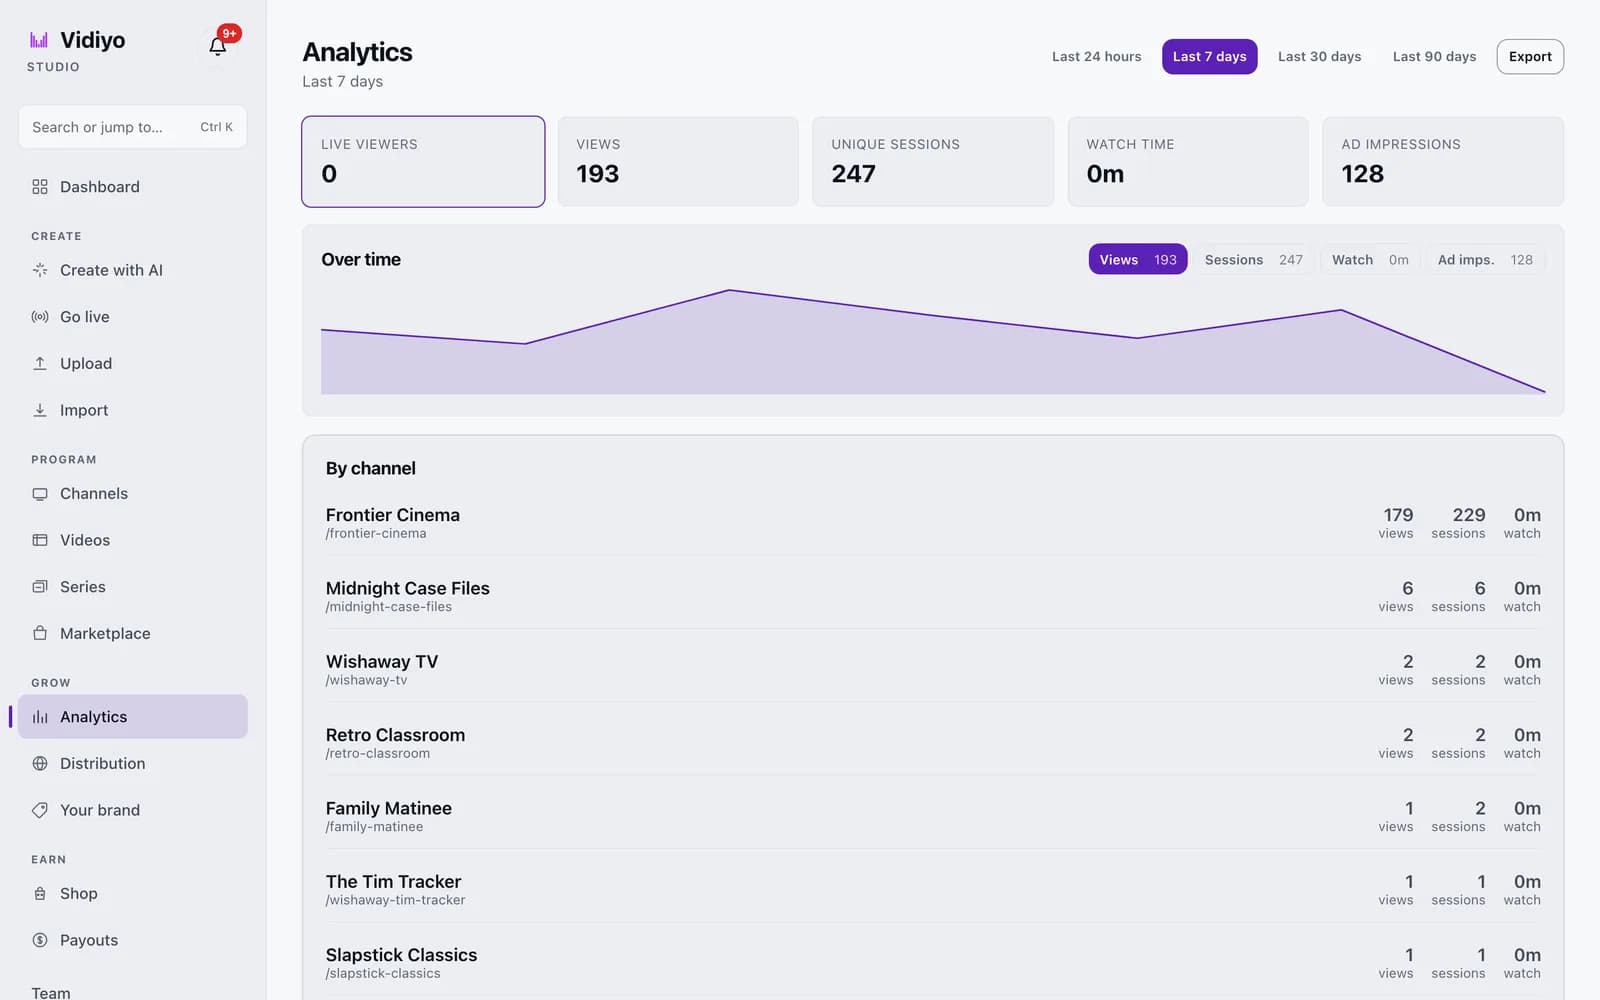
Analytics in Vidiyo Studio shows how people watch your channels: how many views you got, how long they stayed, and how many ads played. The account page covers every channel you own. Each channel also has its own Analytics tab with top content, audience breakdowns, revenue, and retention.
Use it after a schedule change, a new upload, or a live stream to see what moved the numbers.
Before you start
- You need at least one published channel. Analytics reads from the viewer sessions on your channels, so a channel with no viewers shows zeros.
- The longest window is 90 days. Older data is not shown on these pages.
Steps
1. Open Analytics
In the Studio sidebar, under Grow, click Analytics. The page opens on Last 7 days. Switch the window with Last 24 hours, Last 7 days, Last 30 days, or Last 90 days at the top right. Every card, chart, and table on the page follows the window you pick.
2. Read the summary cards
Five cards sit at the top of the page:
- Live viewers: people watching right now across all your channels. It updates on its own while the page is open. The label reads Live viewers (offline) if the live connection drops.
- Views: play starts in the window.
- Unique sessions: distinct viewing sessions.
- Watch time: total minutes watched, shown as hours and minutes when it passes 60 minutes.
- Ad impressions: ads that played inside your channels.
3. Compare metrics over time
The Over time chart plots one metric across the window. Click Views, Sessions, Watch, or Ad imps. above the chart to switch. Each button shows the total for that metric next to its name.
4. Find your strongest channel
The By channel table lists every channel with its views, sessions, and watch minutes for the window. Channels sort by views, so the channel pulling the most traffic is on top. Click a channel name to open that channel in Studio.
5. Break down by platform, country, and content
Below the channel table, the Breakdown card splits the same window three ways. Click Platform, Country, or Content to switch. Each row shows views, sessions, and watch time. On the Content view, click Retention on any row to open a retention curve for that video. Click Export CSV on the card to download the table you are looking at.
6. Open one channel's analytics
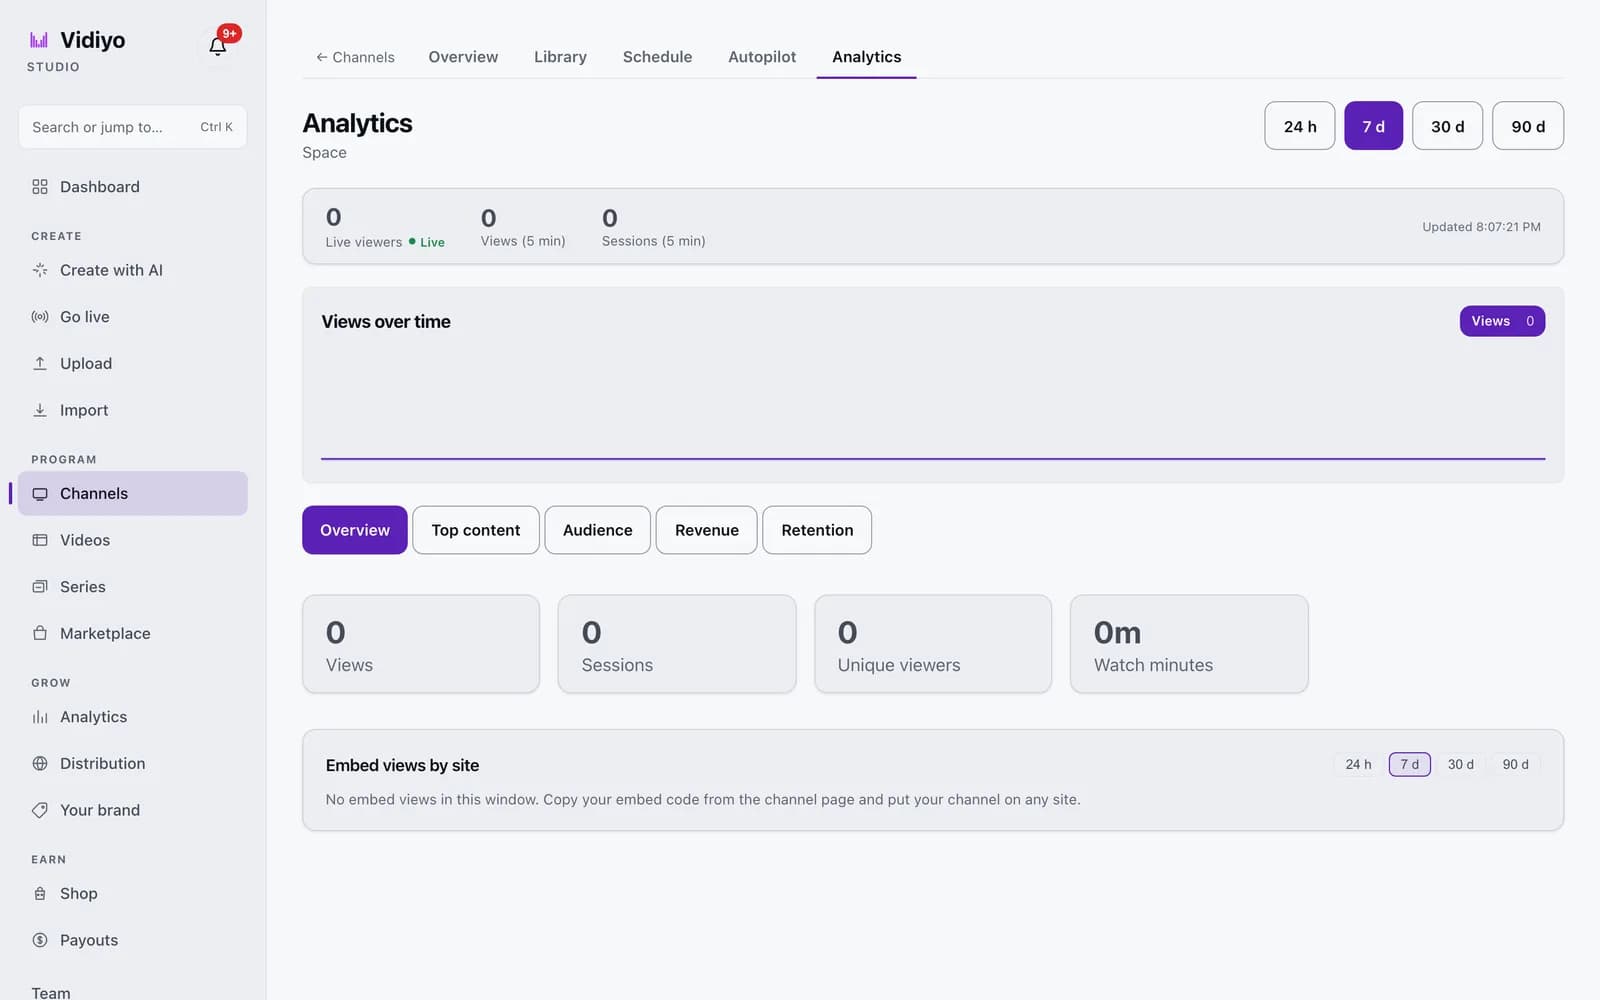
Go to Channels, open a channel, and click the Analytics tab. The window buttons here read 24 h, 7 d, 30 d, and 90 d. The top bar shows Live viewers, Views (5 min), and Sessions (5 min) with an Updated time. Below that, five tabs organize the channel's data:
- Overview: Views, Sessions, Unique viewers, and Watch minutes.
- Top content: a table of the videos that played on this channel with Title, Views, Unique, and Avg watch.
- Audience: the same Platform, Country, and Content breakdown as the account page, limited to this channel.
- Revenue: the ledger lines this channel earned in the window, with Export CSV.
- Retention: average and total watch time, plus a Viewer activity heatmap showing when your audience is most active, in UTC.
The Embed views by site card at the bottom lists the sites where your channel's embed code played. It reads "No embed views in this window" until someone embeds your channel.
7. Export the numbers
On the account Analytics page, click Export at the top right. Studio downloads a JSON file named analytics_7d_<date>.json (the number matches your window) with the summary totals and the views time series. For spreadsheets, use the Export CSV button on the Breakdown, Revenue, or Retention cards instead. Each one downloads the table it sits on, and a toast reading Export ready confirms the file name.
Tips
- Retention curves count watch time from player heartbeats. A session that never sent a heartbeat counts as 0 seconds, so a short spike of drop-offs at the start is normal.
- Completed hours in the Breakdown come from an hourly rollup that runs 5 minutes past each hour. The current hour is counted live, so the totals stay close to current.
- Ad impressions on this page are the count of ads that played. For the money they earned, use the channel's Revenue tab or the Payouts page.
Quick answers
Why does my Analytics page show 0 watch time?
Watch time comes from heartbeats the player sends while a video plays. Very short sessions, or sessions where the player never reported back, count as 0 minutes. Views still count because a view is a play start, not a completed watch.
How often do Vidiyo analytics update?
Live viewers and the 5-minute counters on the channel page update on their own while the page is open. Window totals reload each time you open the page or change the window. Breakdown tables add completed hours from a rollup that runs 5 minutes past each hour and count the current hour live.
What is the difference between views and sessions?
A view is a play start. A session is one viewer's continuous visit, which can include several play starts as the schedule moves from one video to the next. Sessions are usually the better count of people.
Can I download my Vidiyo analytics?
Yes. Click Export on the account Analytics page for a JSON file, or Export CSV on the Breakdown, Revenue, and Retention cards for a spreadsheet-ready file. Each export covers the window you have selected.
Where do I see analytics for one channel?
Open Channels, pick the channel, and click its Analytics tab. The Overview, Top content, Audience, Revenue, and Retention tabs cover that channel alone.
Open Studio
Upload a video, go live, or program your channel. Studio is free, and every guide here walks you through one task.